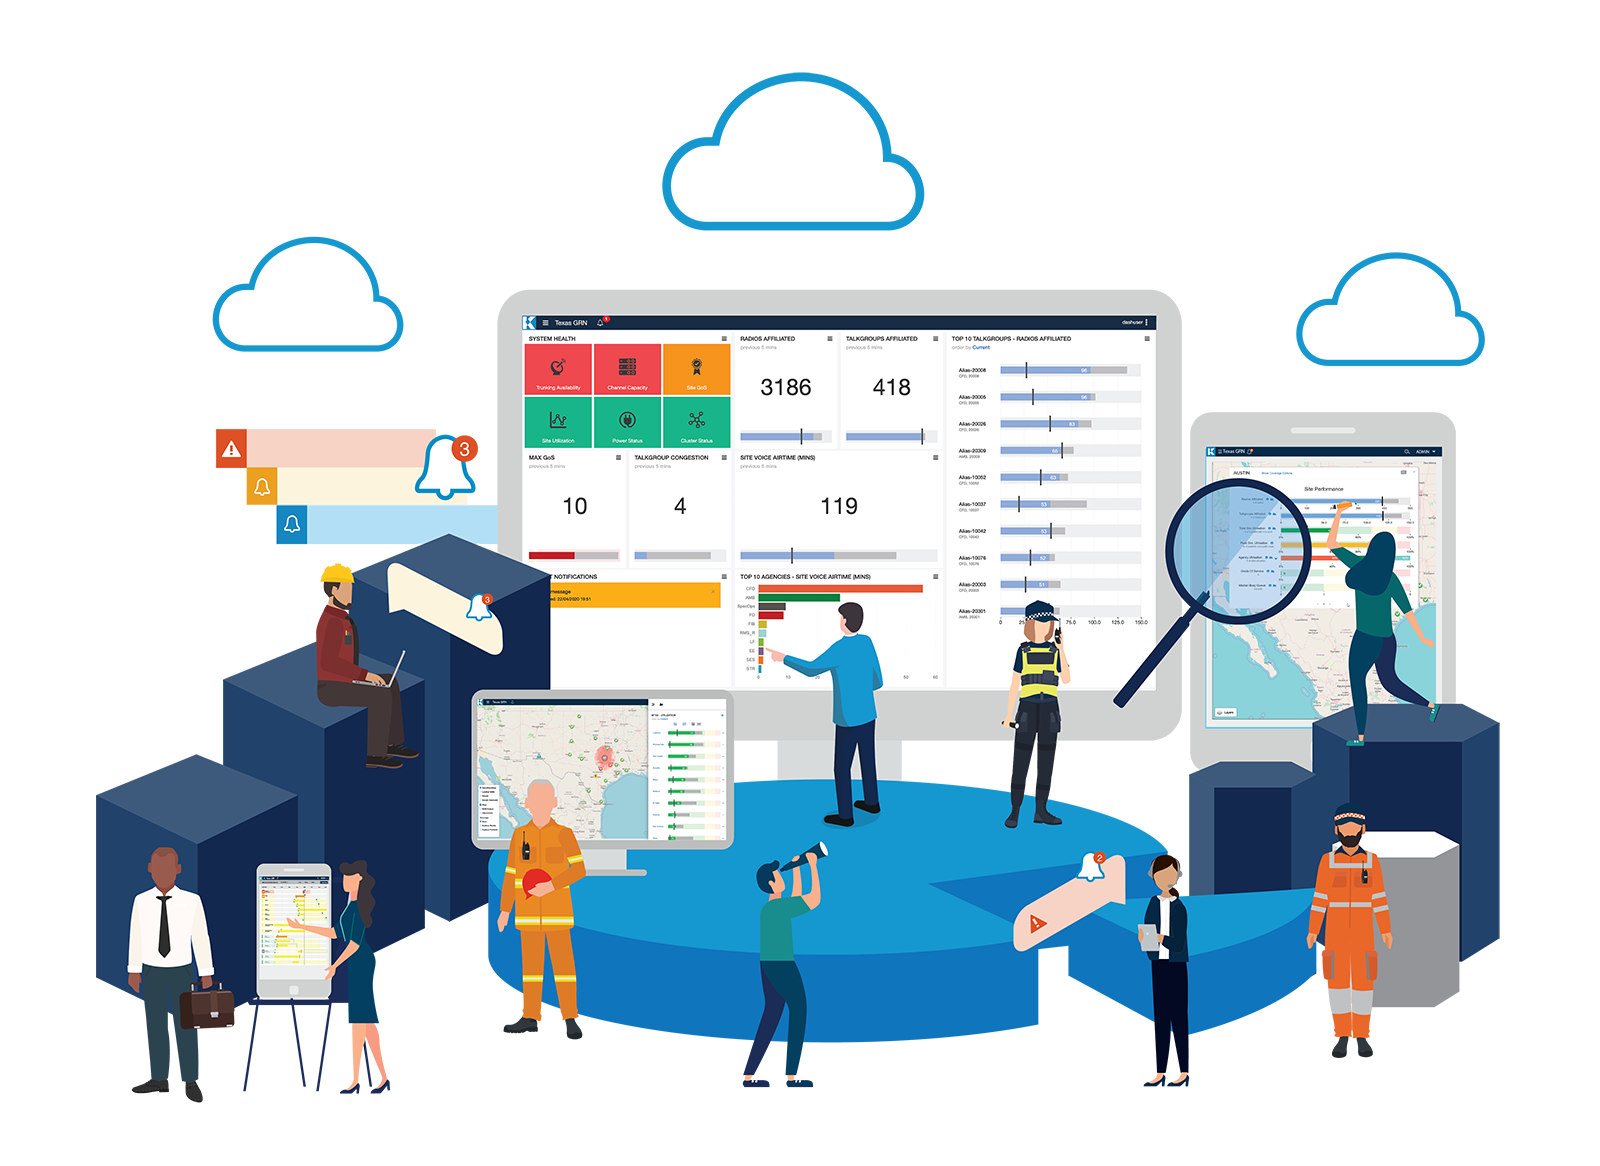
Kalibre Insight Performance Dashboard
Gain near-real-time visibility into critical performance data
The Kalibre Insight Dashboard developed by Kalibre displays near real time & historical system health and performance data at a system-wide, site, agency and talk group level.
System Overview
The System Overview displays current health or performance issues, various interactive performance metrics, and active notifications.
Geographic Display
Interactive geographical views of site health and performance information with advanced overlays and predictive analytics.
Service Level Manager (SLM)
Measure, track and report against Service Level Agreements in near real time, highlights when notifications are required, target resolutions, and any planned outages.
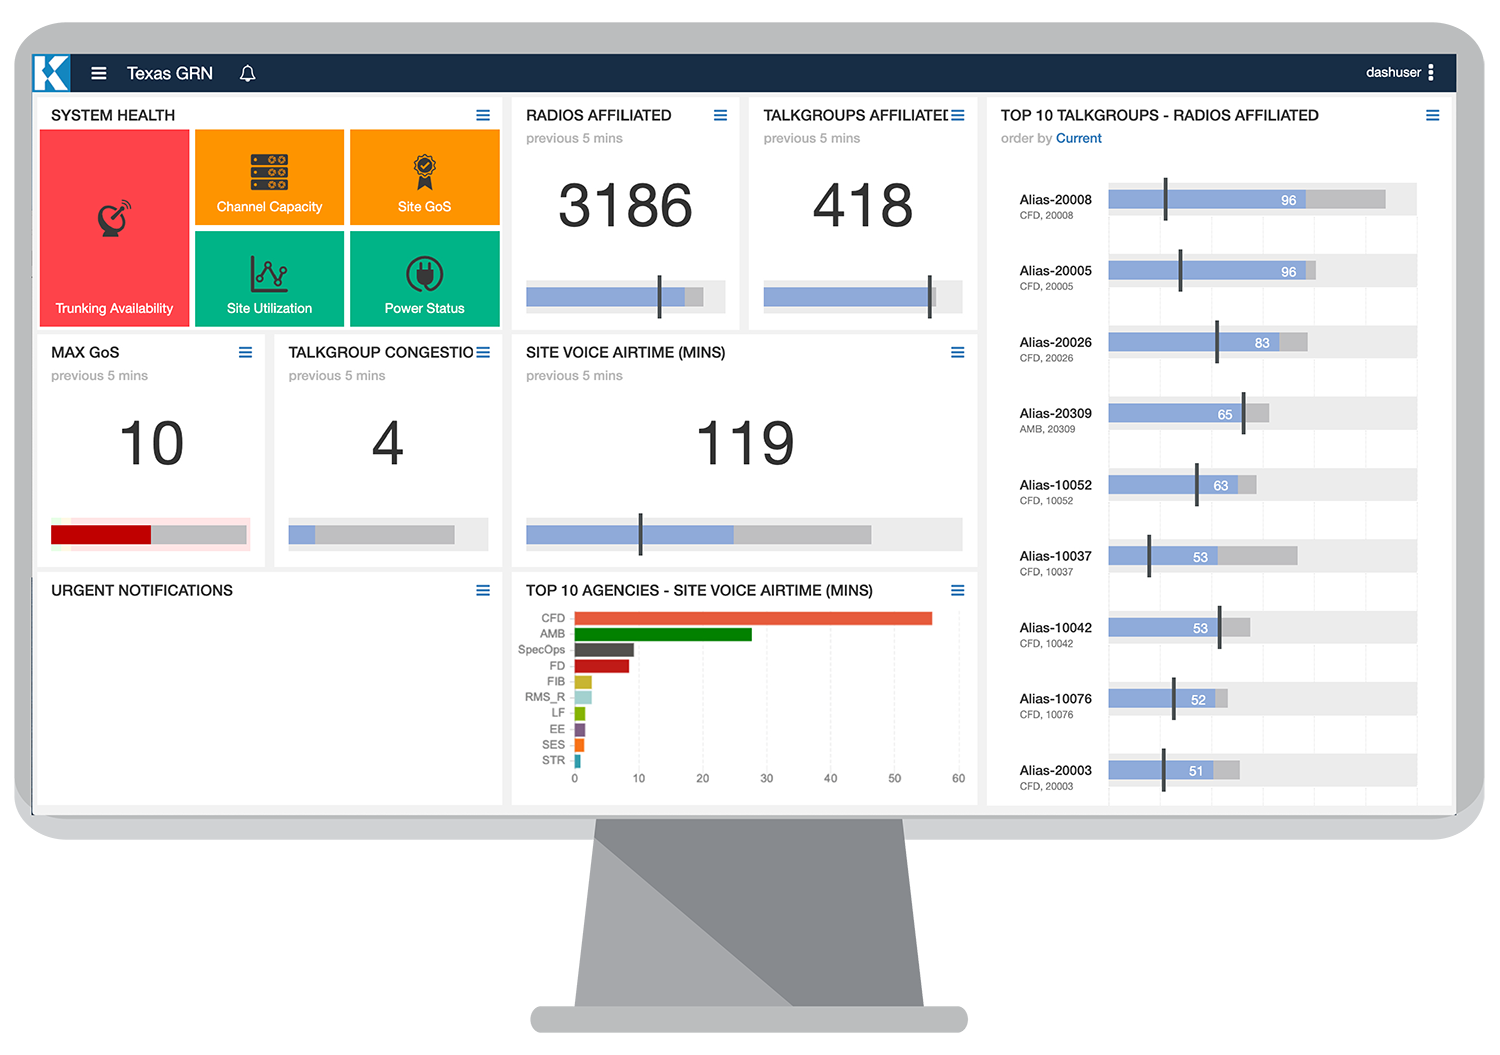
System Overview
The System overview includes a System Health Summary for services such as Trunking Availability, Channel Capacity, Simulcast Availability, Sub-site Channel Capacity, Site GoS & Site Utilisation, the worst status at any of the sites will determine the colour shown for each service.
Users can easily switch between summary and detail views. Detail lists the actual sites that are experiencing service health issues, their status, and when the issue occurred.
Geographic Display
The Geographic Display includes a search feature, map layer control, side bar, site performance pop ups and predictive analytics.
The icons shown on the map are derived from the status of the services, with the ability to show different icons based on the service that has been impacted. Click the links below to see examples of these features.
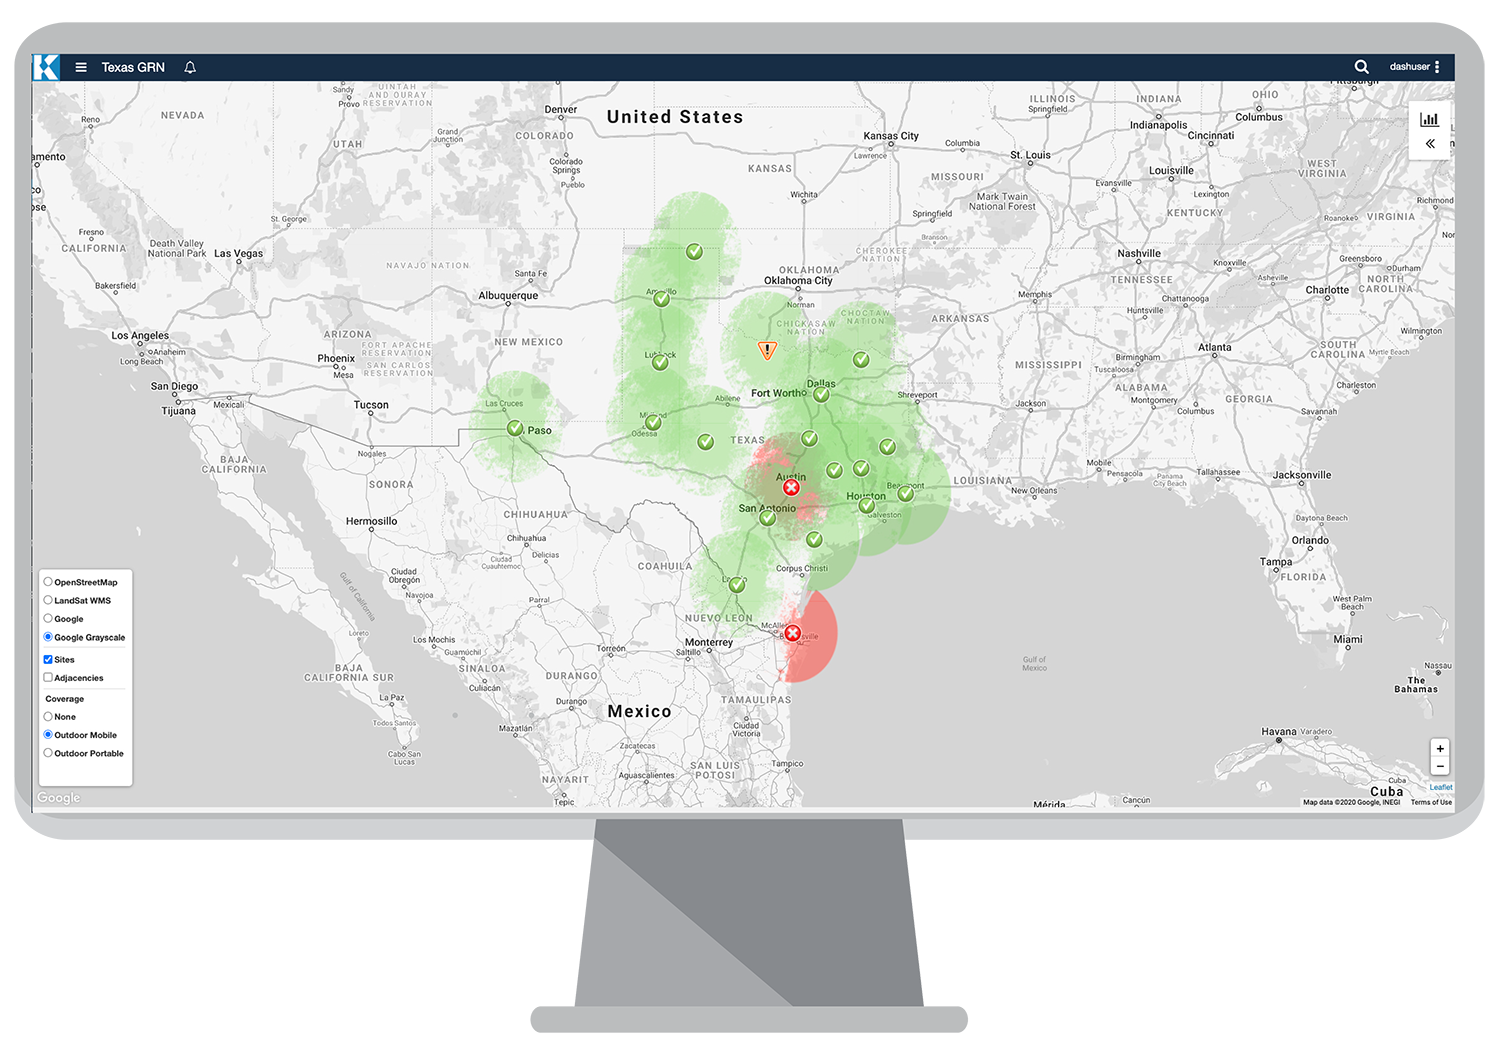
The map layer control allows the user to apply layers such as sites, regions, coverage and external sources such as weather or customer RSS feeds.
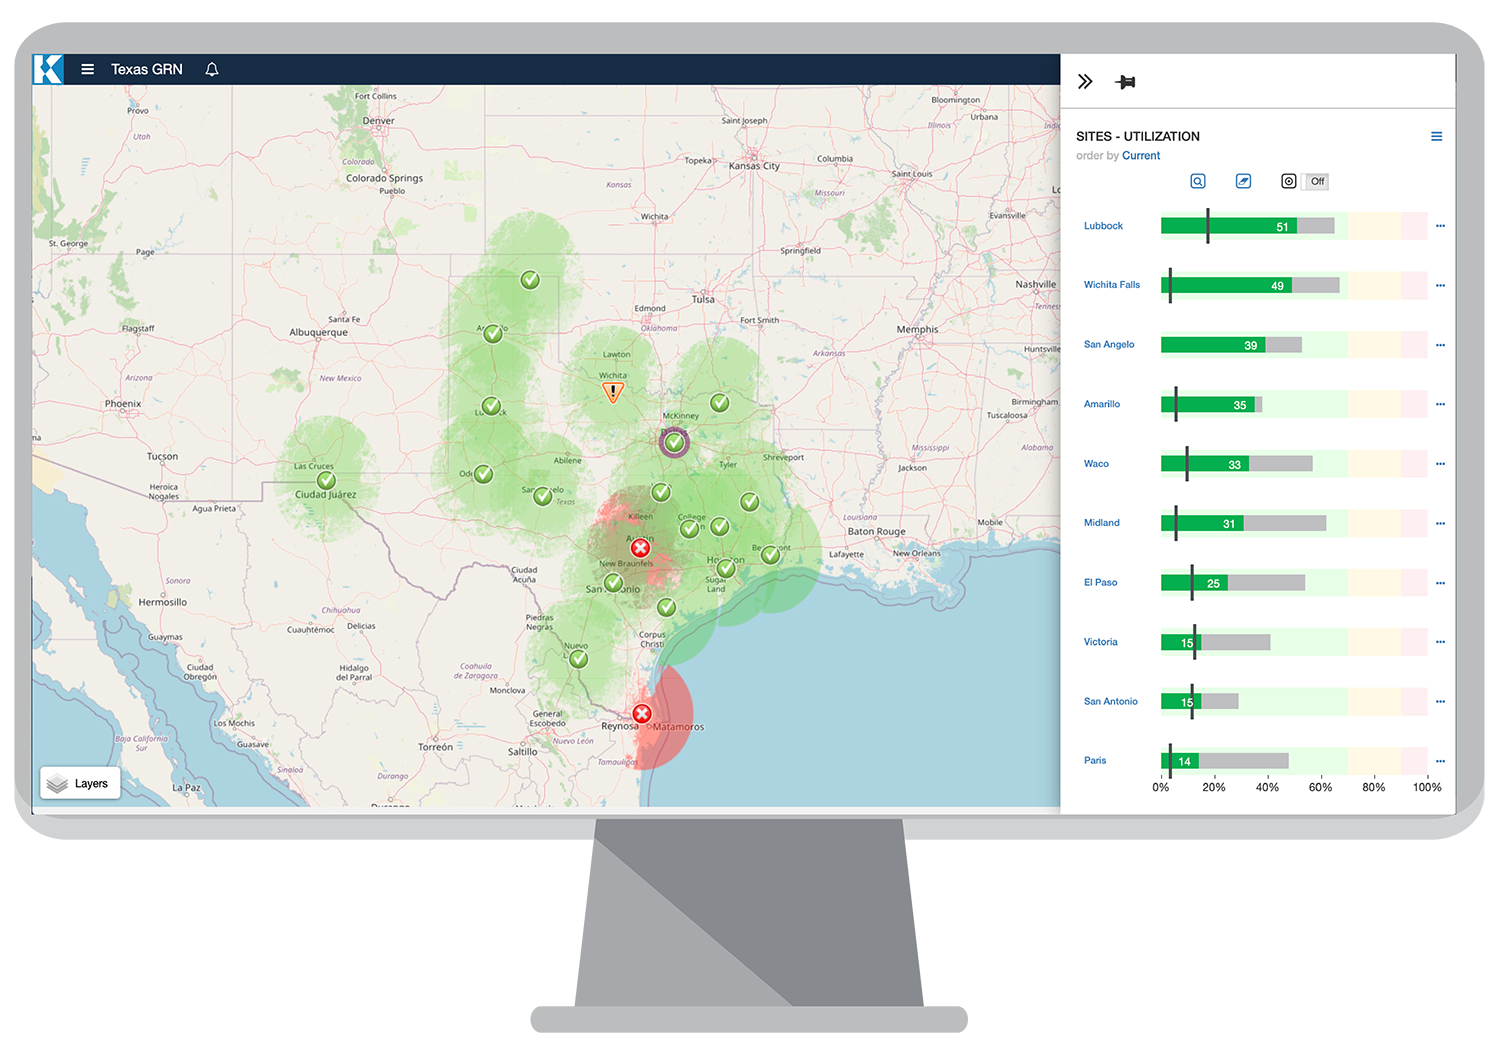
The side bar displays bullet charts for the top ten sites for a selected metric, with the ability to zoom the map to fit the top 10 sites, highlight the top 10 sites, view a historical chart or view the site performance pop up.
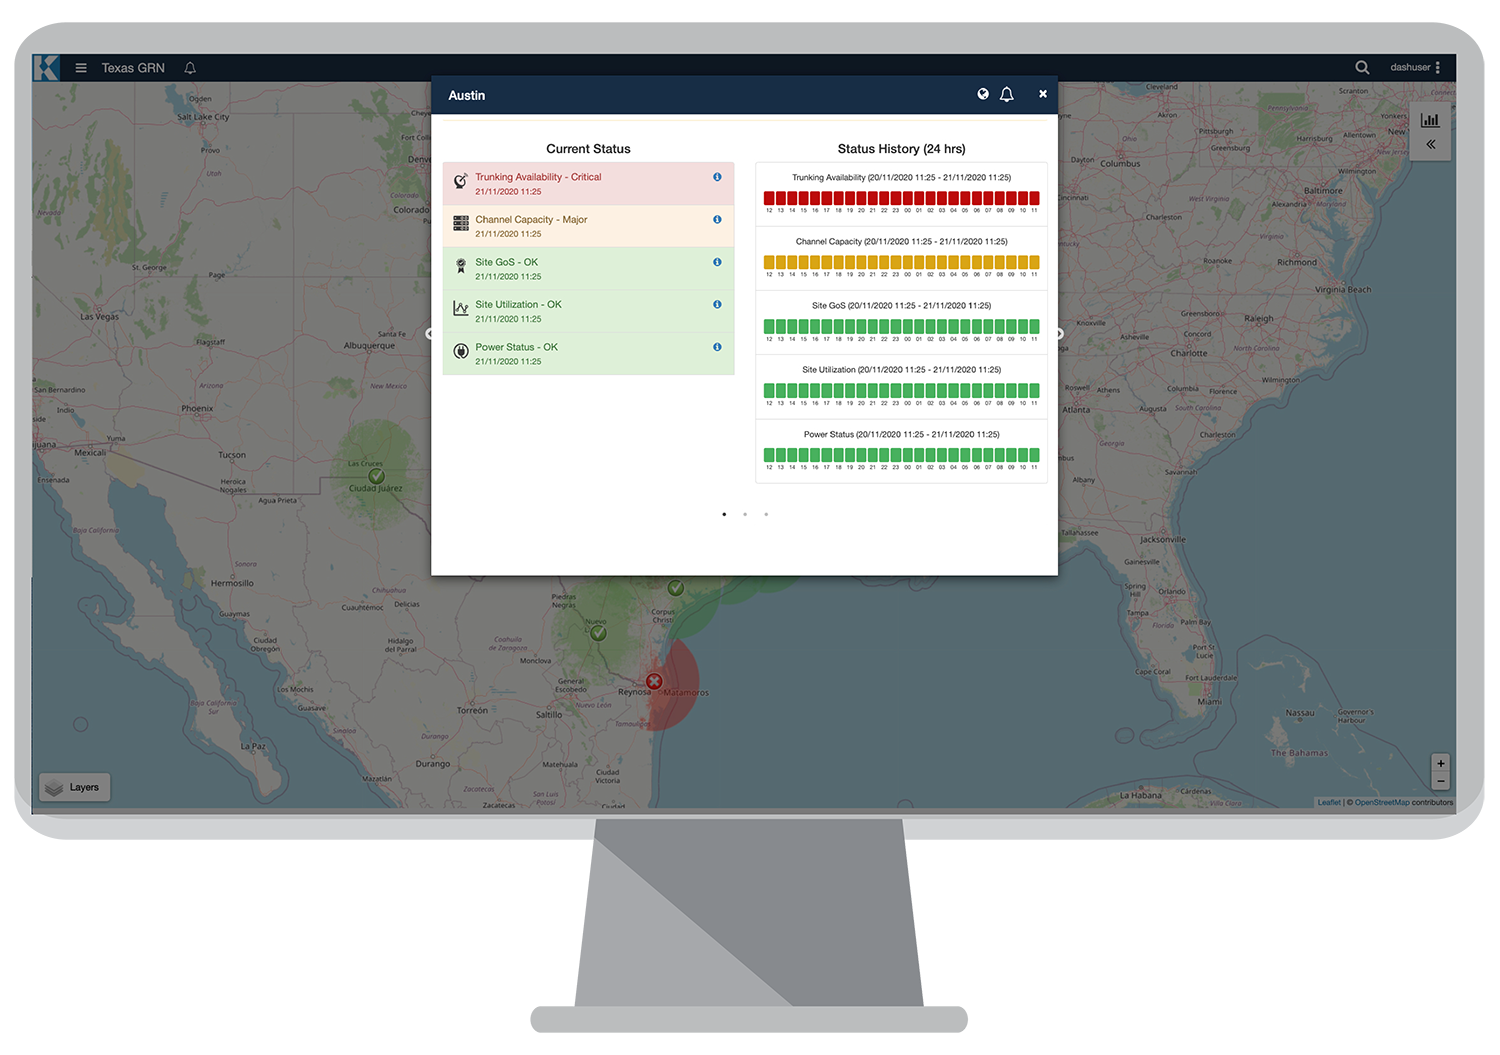
Click on a site on the Map to display site performance pop-up to provide additional information such as Site Status, Site Performance, and Site Notifications
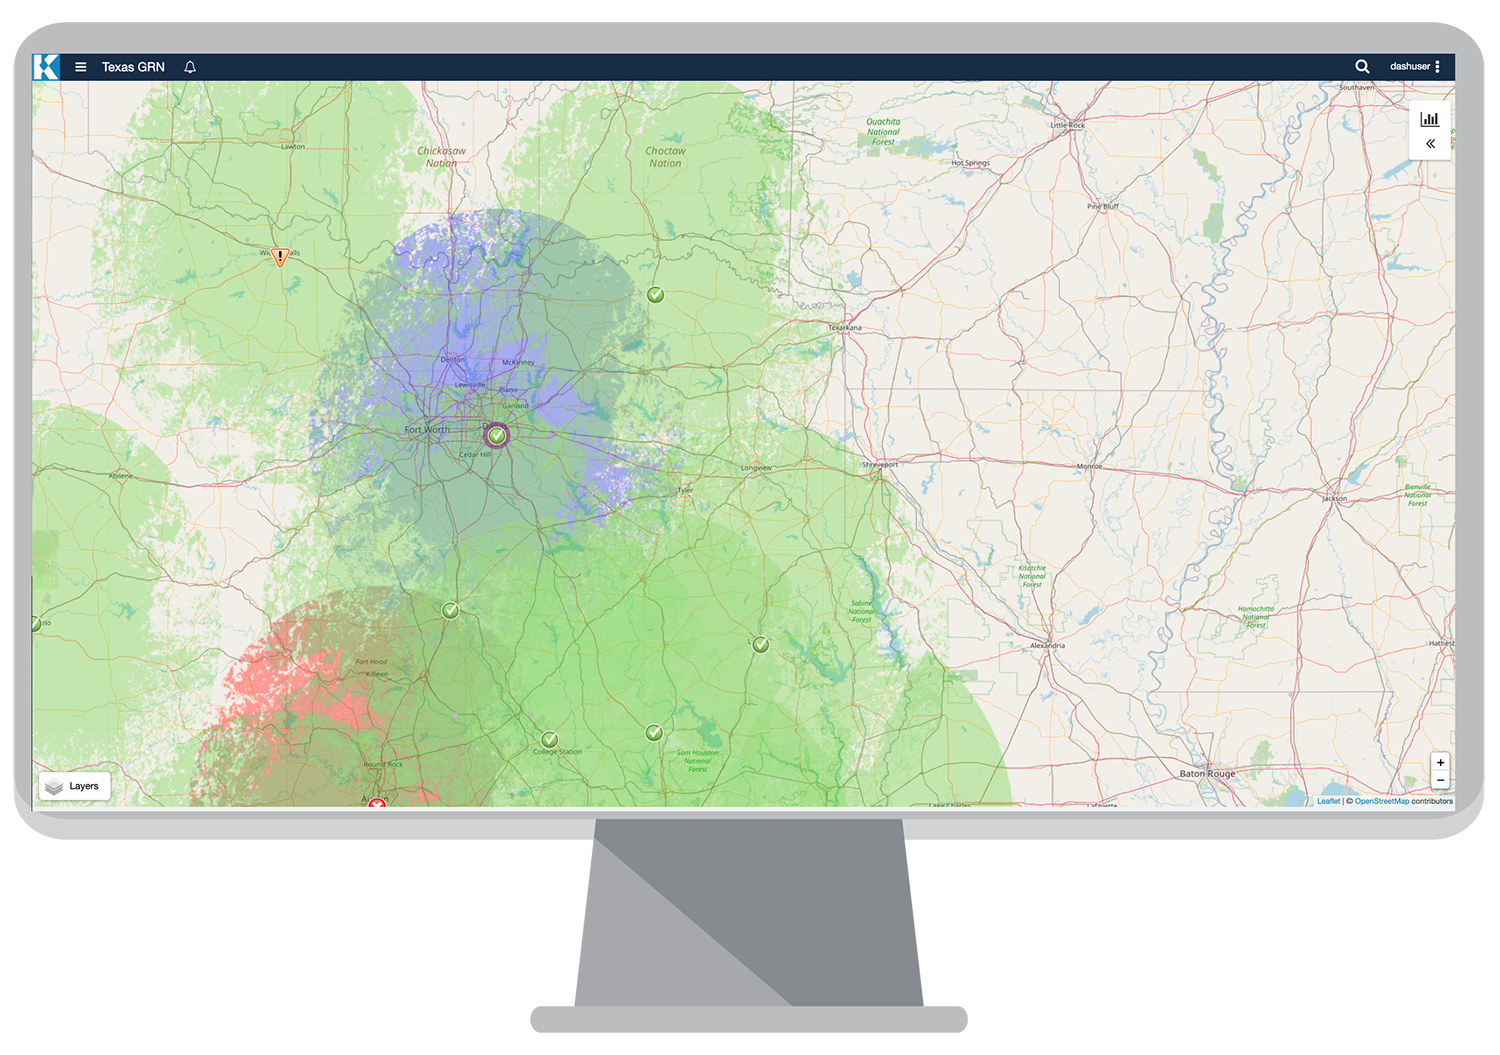
Forecast future outcomes based on historical data and predictive analytics, system users can simulate and predict the impact of planned maintenance or site outages on coverage and zoom-in to see the impact more clearly.
Features
User Authentication
Two factor authentication to authenticate users based on group and role based access.
Alerts & Notifications
System wide threshold based alerts and notifications for sites with the ability to subscribe to
& snooze notifications.
User Defined Views
The right level of visibility and information is provided to users based on group membership, ensuring they are not overloaded with data.
Simulation
Display upcoming planned maintenance or simulate the impact of outages on coverage.
GIS Layers
Interactive geographical views of site health and performance with GIS from any provider such as Google & OpenStreetMap with advanced overlays including data from the Australian Bureau of Meteorology and predictive analytics.
Performance Data Warehouse
Integrates with raw data from systems including Genesis GenWatch3-ATIA, Operations Bridge Manager and other business applications. Data is cached within the Dashboard to minimise load on underlying databases and systems.

Flexible Deployments
The Kalibre Insight Dashboard integrates with a broad range of public safety communications infrastructure, including Motorola Solution UEM, Aviat ProVision, Nokia NFM-P, NEC UNMS/PNMS, Solarwinds, PRTG and many more.
Kalibre also partners with leading infrastructure vendors including HPE, Nutanix, Veeam, Zerto and F5 to deploy the solution in a variety of configurations including cloud or on -premise, standalone, DR ready and fully resilient options.
Data management
The Kalibre Insight Dashboard integrates raw data from systems including Genesis GenWatch3-ATIA, Operations Bridge Manager and other business applications.
Near-real-time system performance data is pre-cached by the Dashboard to ensure users are presented with key information within seconds
A key component of the Kalibre solution is the Kalibre Insight Performance Data Warehouse (KPDW) which performs data translation and aggregation for ASTRO25 performance data from the Genesis system.
All aggregated data available within the Kalibre Dashboard can be accessed via a web services API for use in downstream systems (such as customer workflow solutions).
Data is cached within the Dashboard to minimise load on the underlying databases and systems, and is designed to present all near-real-time views to the user within seconds.