Operations Bridge
Improve visibility and insight of system health and network performance with the
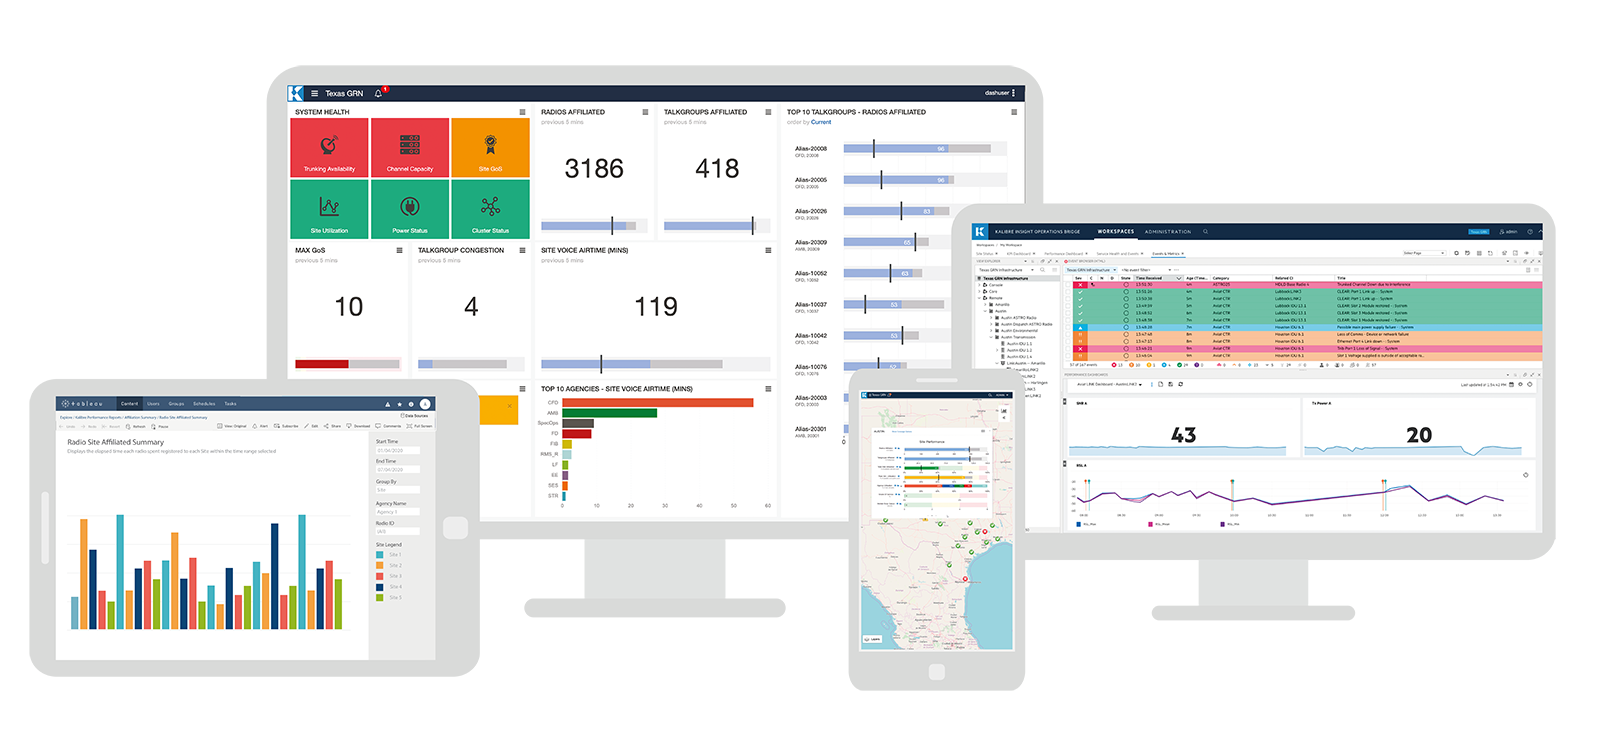
System health & network performance information is available online via
Operations Bridge Manager, Kalibre Insight Performance Dashboard and Performance Reports.
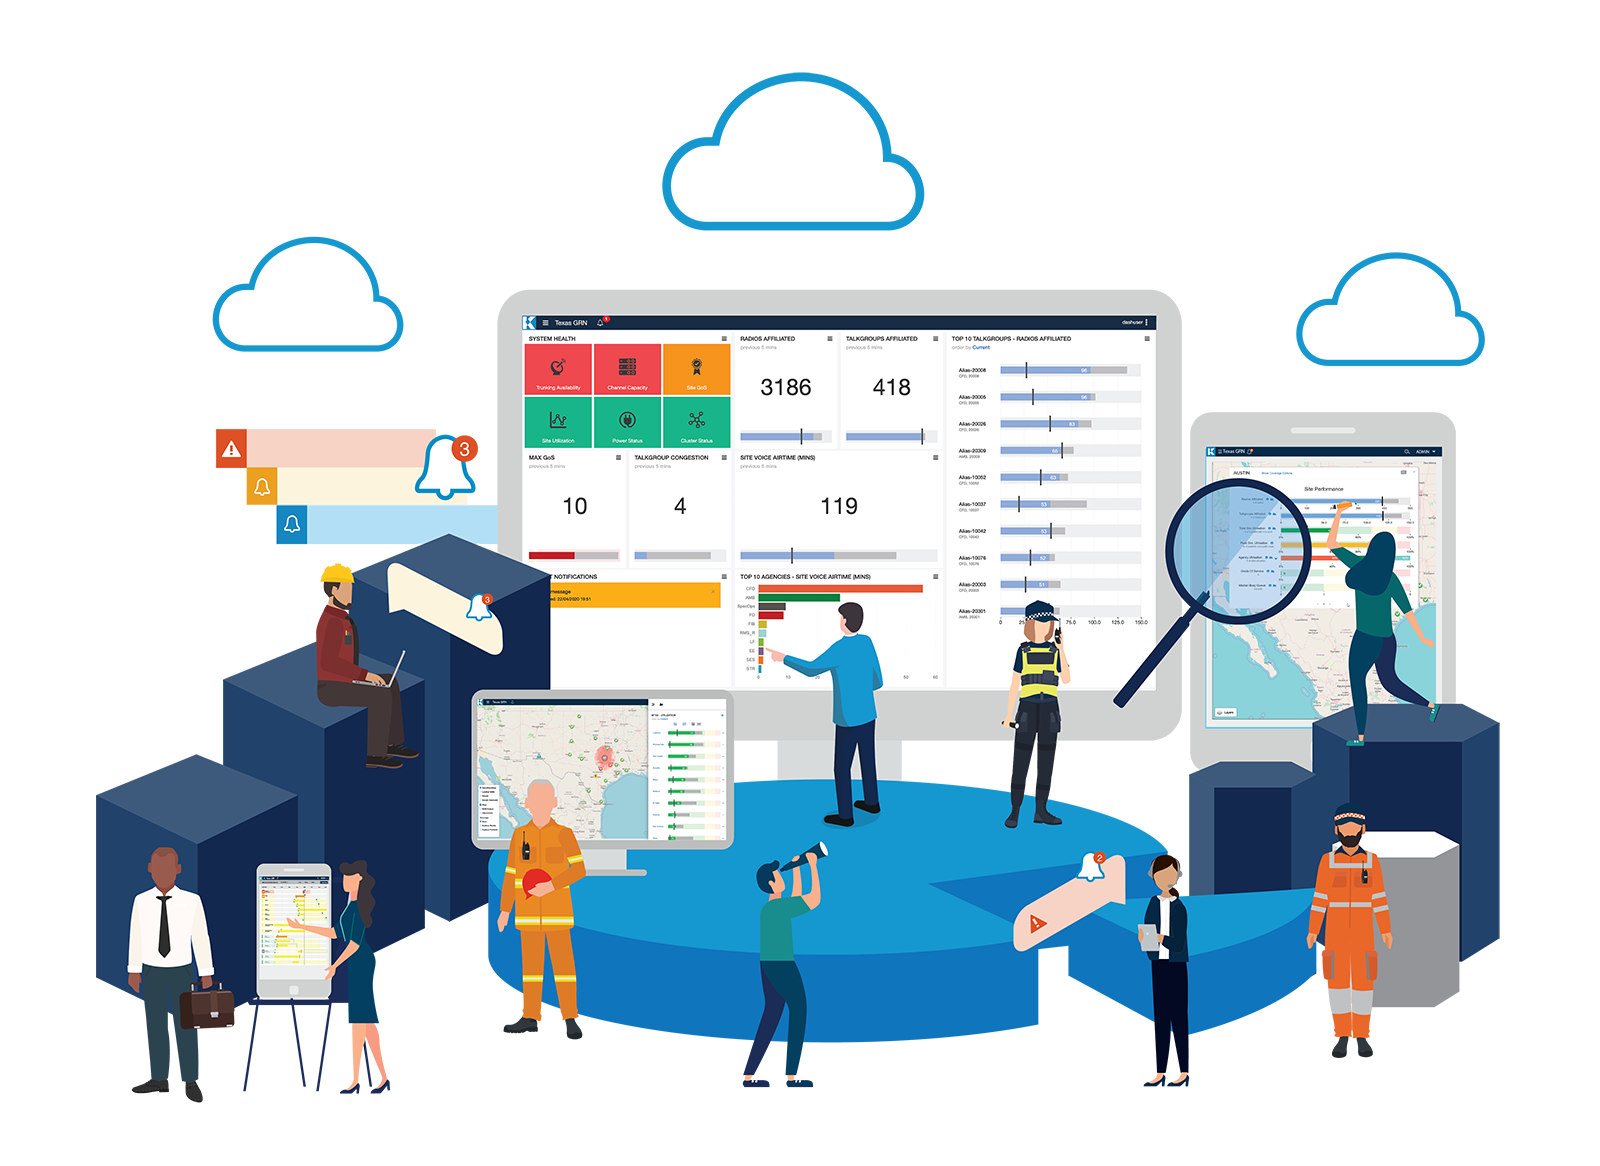
Increase information availability with system health & network performance available on any device, anywhere, anytime, viewable on desktops, tablets or smartphones.
System users have access to targeted critical operational data to quickly identify issues and make data driven decisions. The result is a reduction in the time taken to resolve faults, improved service levels and productivity.
- Speed root cause analysis
- Faster reporting & analysis
- Better business decisions
- Improved collaboration & insight
- Improved operational efficiency
- Improved customer satisfaction
- Increased competitive advantage
Operations Bridge Manager
Kalibre is a Micro Focus Partner and can deploy Operations Bridge Manager to consolidate all of your monitoring into a central console, with a single view of system availability and capacity across your entire network. Minimising the number of events that operators need to process.
Performance Dashboard
The Kalibre Insight Performance Dashboard Displays system health and performance data at multiple levels including system-wide, site, agency and talk group level, incorporating interactive performance metrics and geographical views with advanced overlays, predictive analytics and system notifications.
Performance Reports
Kalibre is a Tableau Partner, we can deploy an enterprise-grade secure, governed and scaled analytics solution. We partner with our clients to leverage the full power of their operational data and provide business insights that are readily available across your entire organisation.
Operations Bridge Manager
Operations Bridge collects topology, fault/event, and performance metric data from all infrastructure and applications in your environment, including Motorola UEM, Aviat Provision, Nokia NFM-P, NEC PNMS/UNMS, Solarwinds and many more.
Event correlation rules relate root cause events automatically as the events are received, reducing the number of events that operators need to process, speeding root cause analysis & reducing the average time to restore.
Data is stored at a forensic level for historical analysis and pattern detection.
- Central console – a single view into your infrastructure
- Combined faults & performance metrics to resolve issues
- Event correlation – to reduce noise & speed root cause analysis
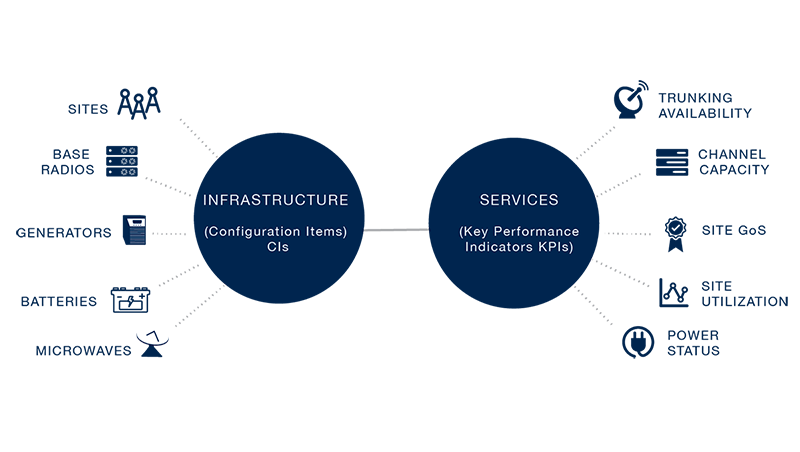
- Infrastructure mapped to business services
- Service health monitoring and reporting
Operations Bridge Manager
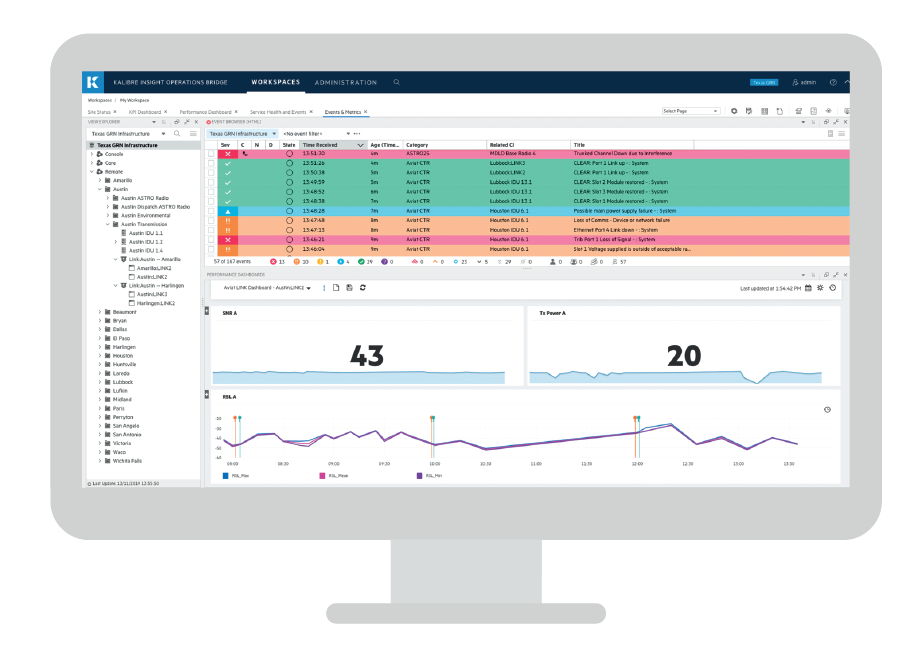
Service Health Monitoring
Operations Bridge extends monitoring from infrastructure to business services and maps infrastructure faults to the impact on services that you provide to your customers.
Identify the real business impact of infrastructure faults on the services you
provide to your customers, and more effectively prioritise resources.
Services impacted by infrastructure faults are shown in real time,
allowing operators to focus their efforts in the right places.
Performance Dashboard
The Kalibre Insight Performance Dashboard developed by Kalibre displays near real time & historical system health and performance data at multiple levels including system-wide, site, agency and talk group level, incorporating interactive performance metrics and geographical views with advanced overlays, predictive analytics and system notifications.
Data is collected from Genesis GenWatch3 & Operations Bridge Manager and transformed into different views.
- System Overview
- Geographic Display
- Service Level Manager (SLM)
- Site Performance Pop-ups
- Alerts & Notifications
- User Authentication
- User Defined Views
Kalibre Insight Dashboard
System Overview
The System Overview displays current health or performance issues, various interactive performance metrics, and active notifications.
Geographic Display
Interactive geographical views of site health and performance information with advanced overlays and predictive analytics.
Service Level Manager (SLM)
Measure, track and report against Service Level Agreements in near real time, highlights when notifications are required, target resolutions, and any planned outages.
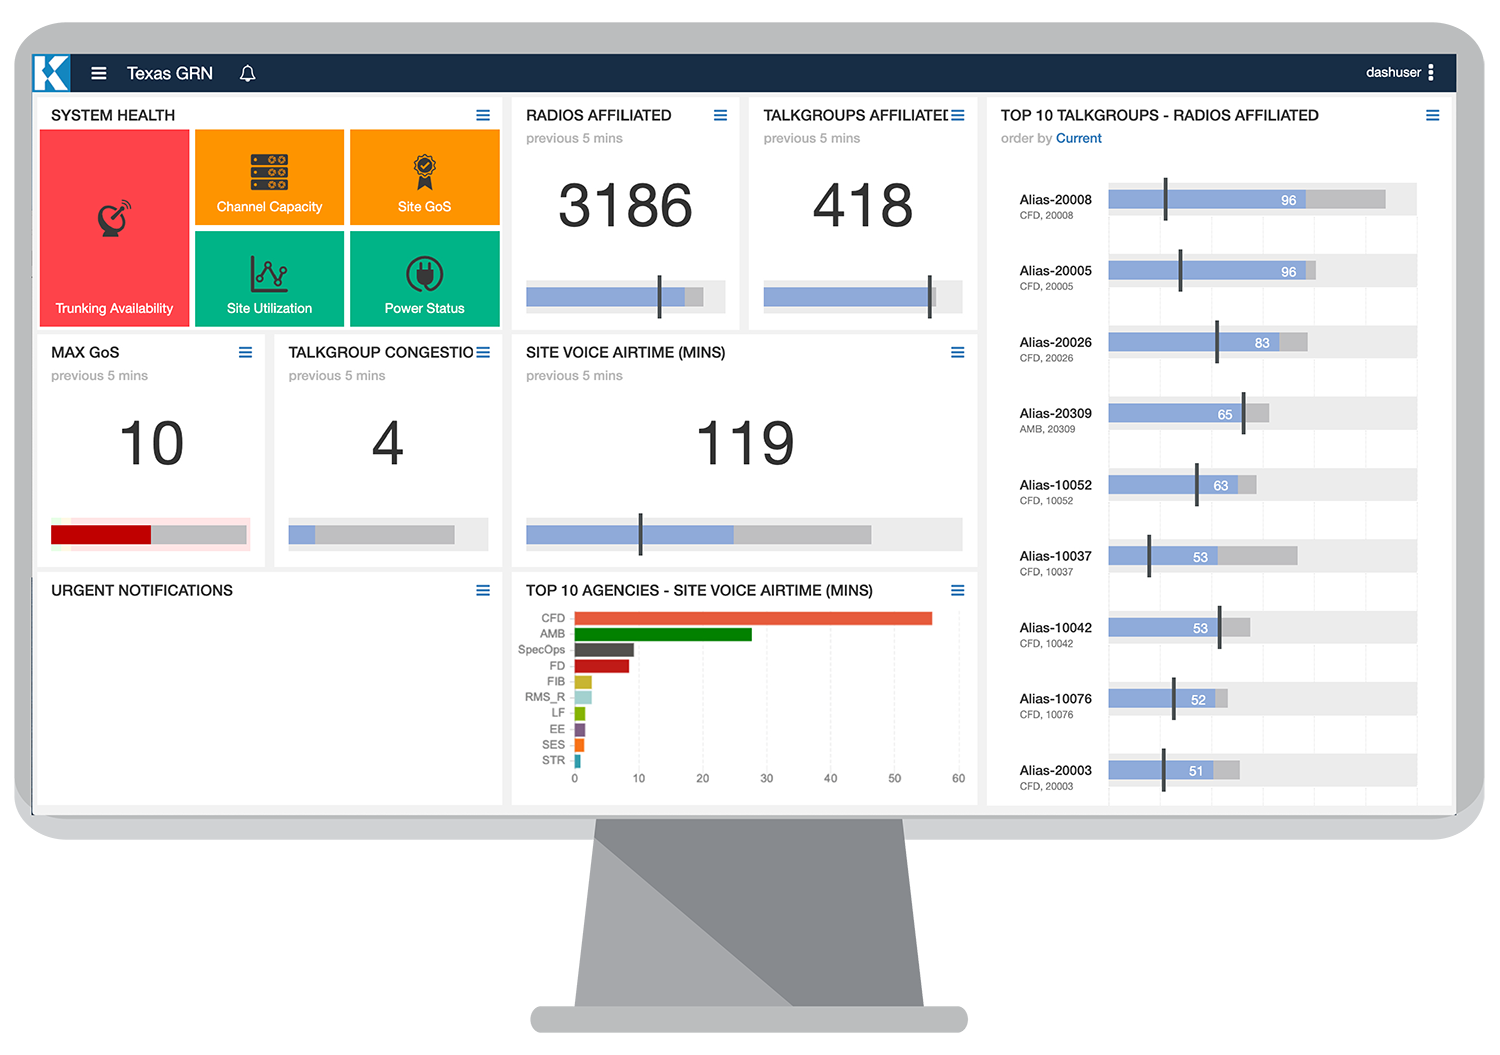
System Overview
The System overview includes a System Health Summary for services such as Trunking Availability, Channel Capacity, Simulcast Availability, Sub-site Channel Capacity, Site GoS & Site Utilisation, the worst status at any of the sites will determine the colour shown for each service.
Users can easily switch between summary and detail views. Detail lists the actual sites that are experiencing service health issues, their status, and when the issue occurred.
Notifications can be created to provide the users with additional information and warnings about events occurring on sites, such as scheduled maintenance, or estimated restoration times for unscheduled outages.
Notifications are assigned to different levels depending on the severity of the notice. Urgent notifications will pop-up in a banner at the top of the Dashboard automatically and will also increment the counter on the notification icon.
Geographic Display
The Geographic Display includes a search feature, map layer control, side bar, site performance pop ups and predictive analytics.
The icons shown on the map are derived from the status of the services, with the ability to show different icons based on the service that has been impacted. Click the links below to see examples of these features.
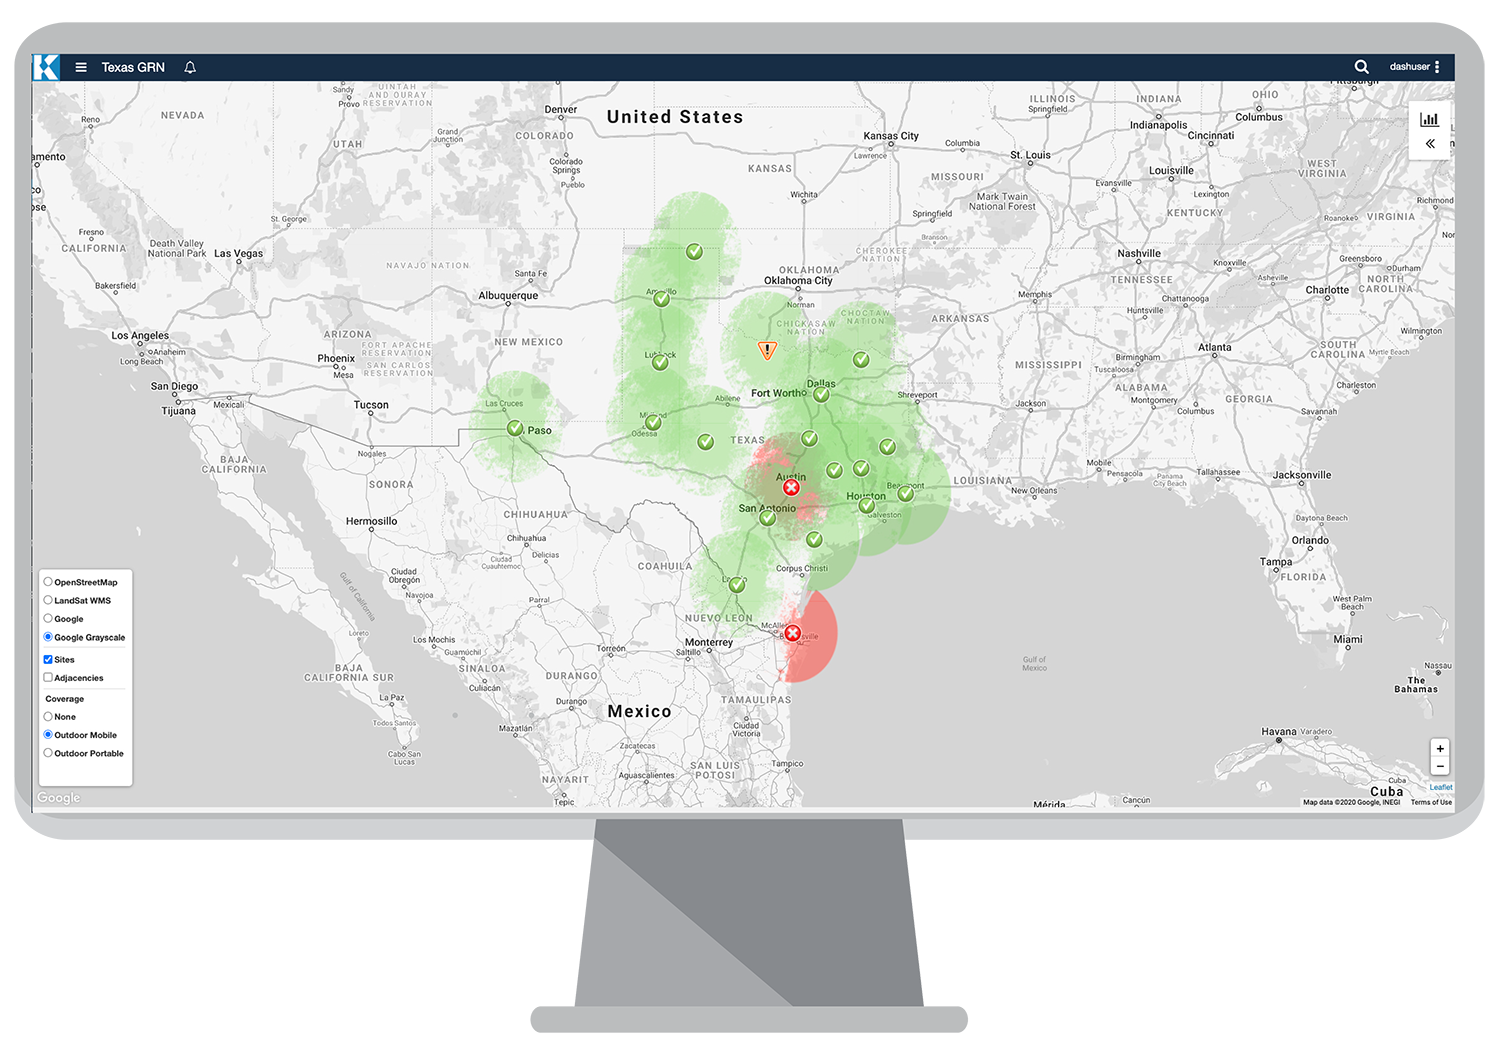
The map layer control allows the user to apply layers such as sites, regions, coverage and external sources such as weather or customer RSS feeds.
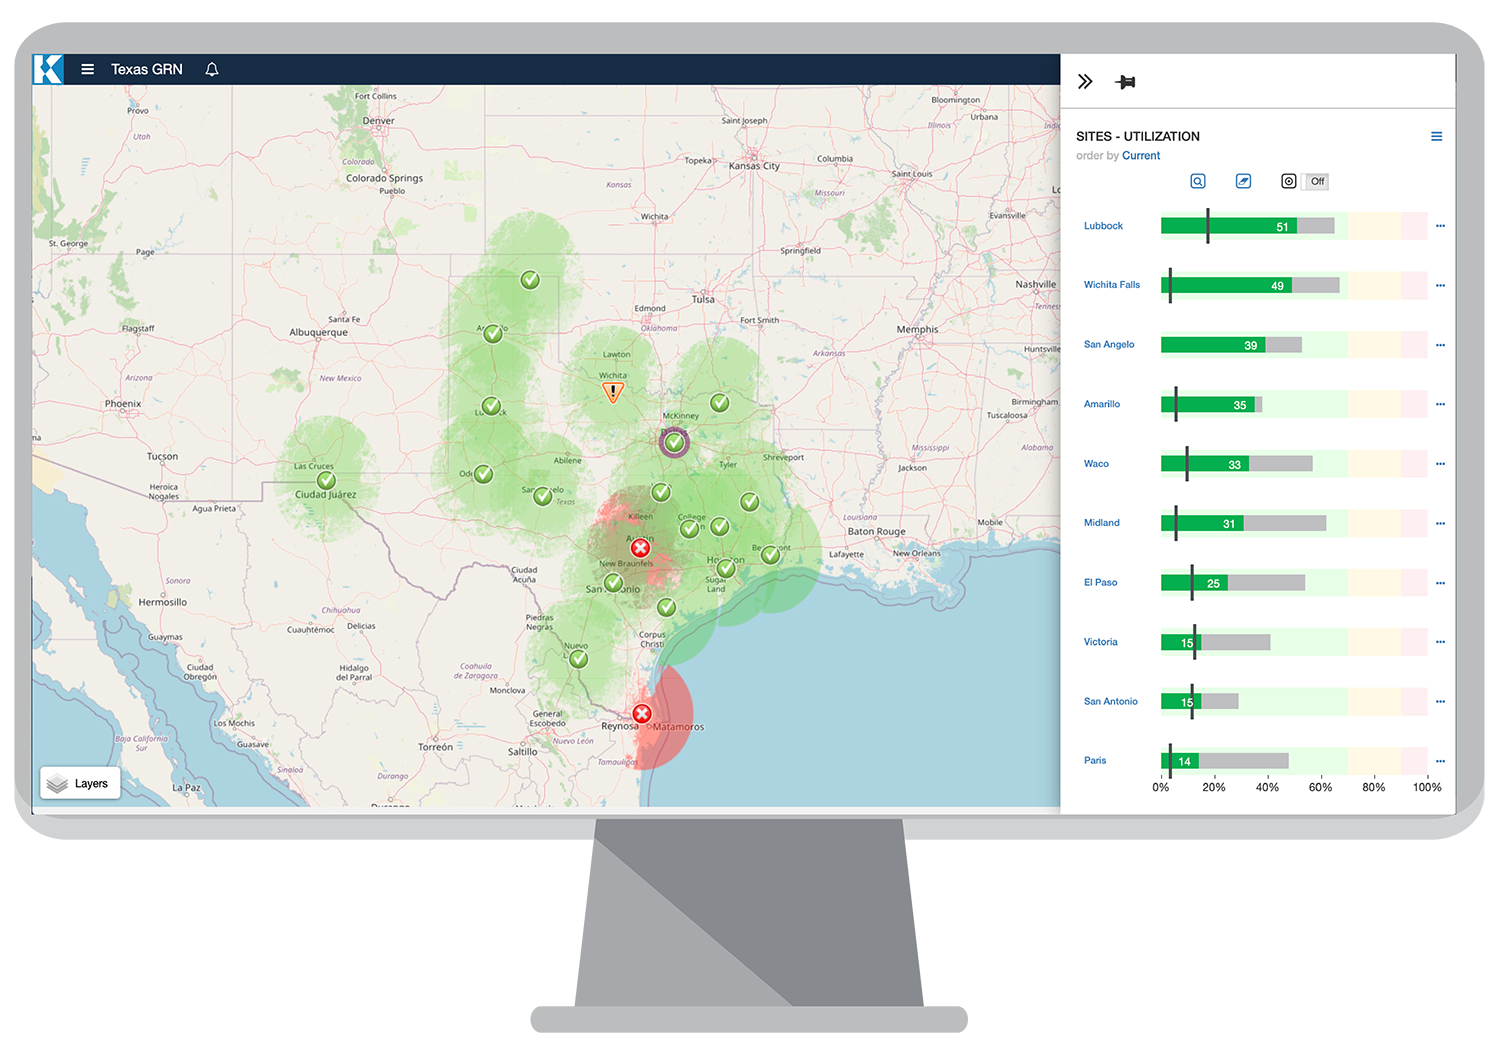
The side bar displays bullet charts for the top ten sites for a selected metric, with the ability to zoom the map to fit the top 10 sites, highlight the top 10 sites, view a historical chart or view the site performance pop up.
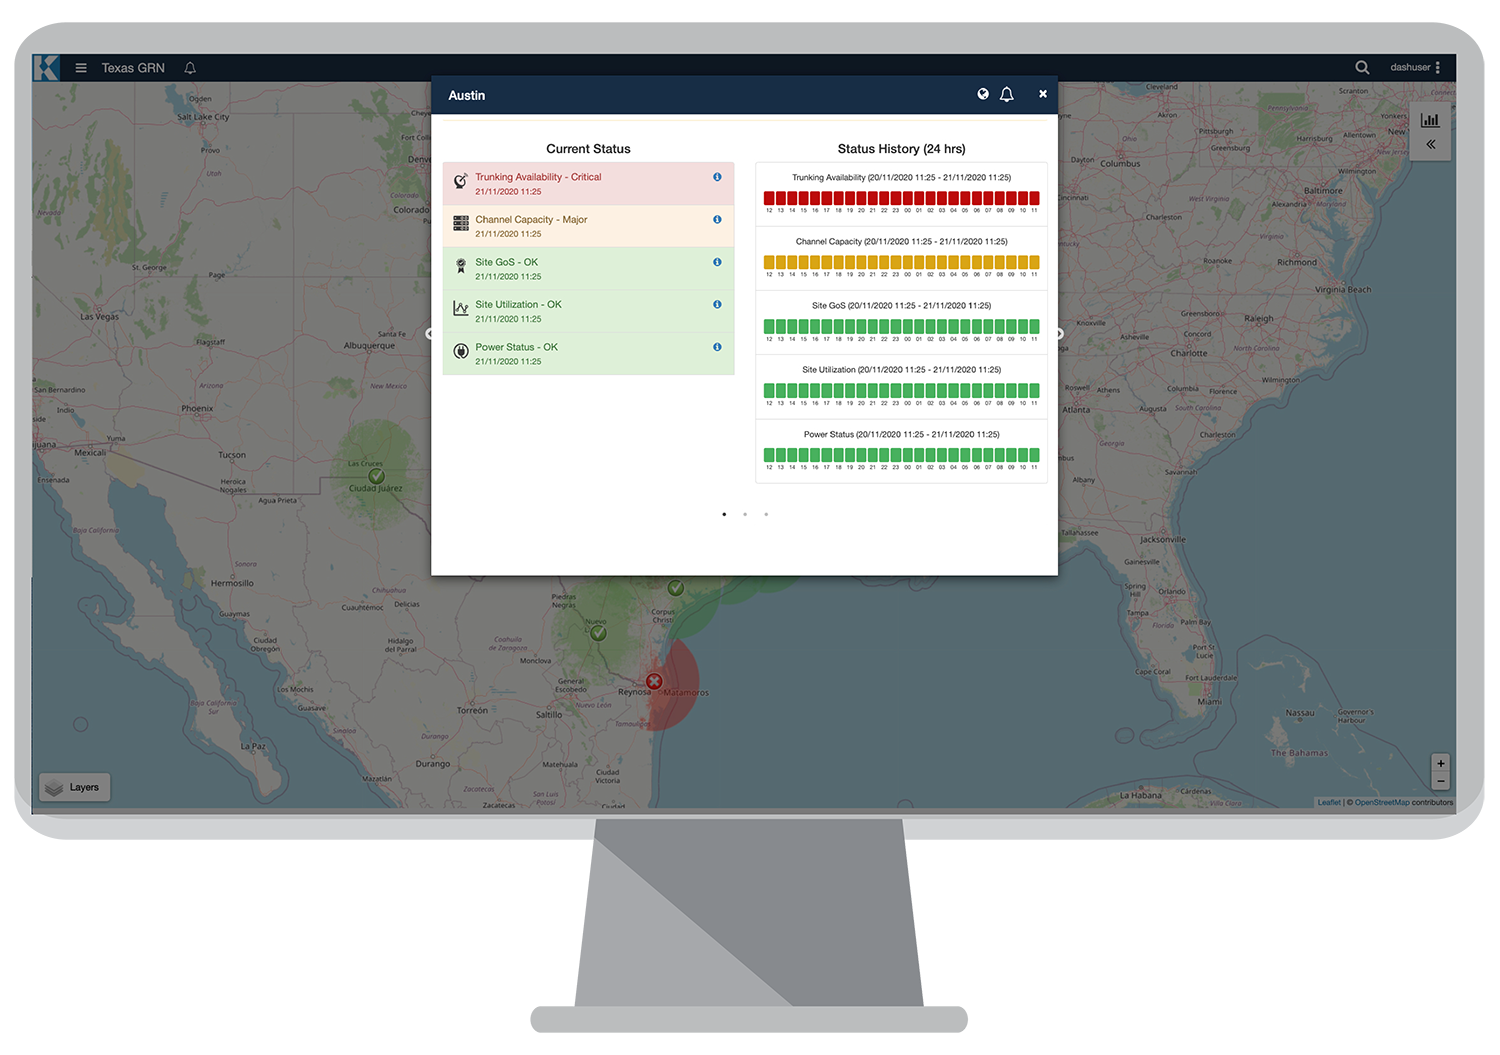
Click on a site on the Map to display site performance pop-up to provide additional information such as Site Status, Site Performance, and Site Notifications
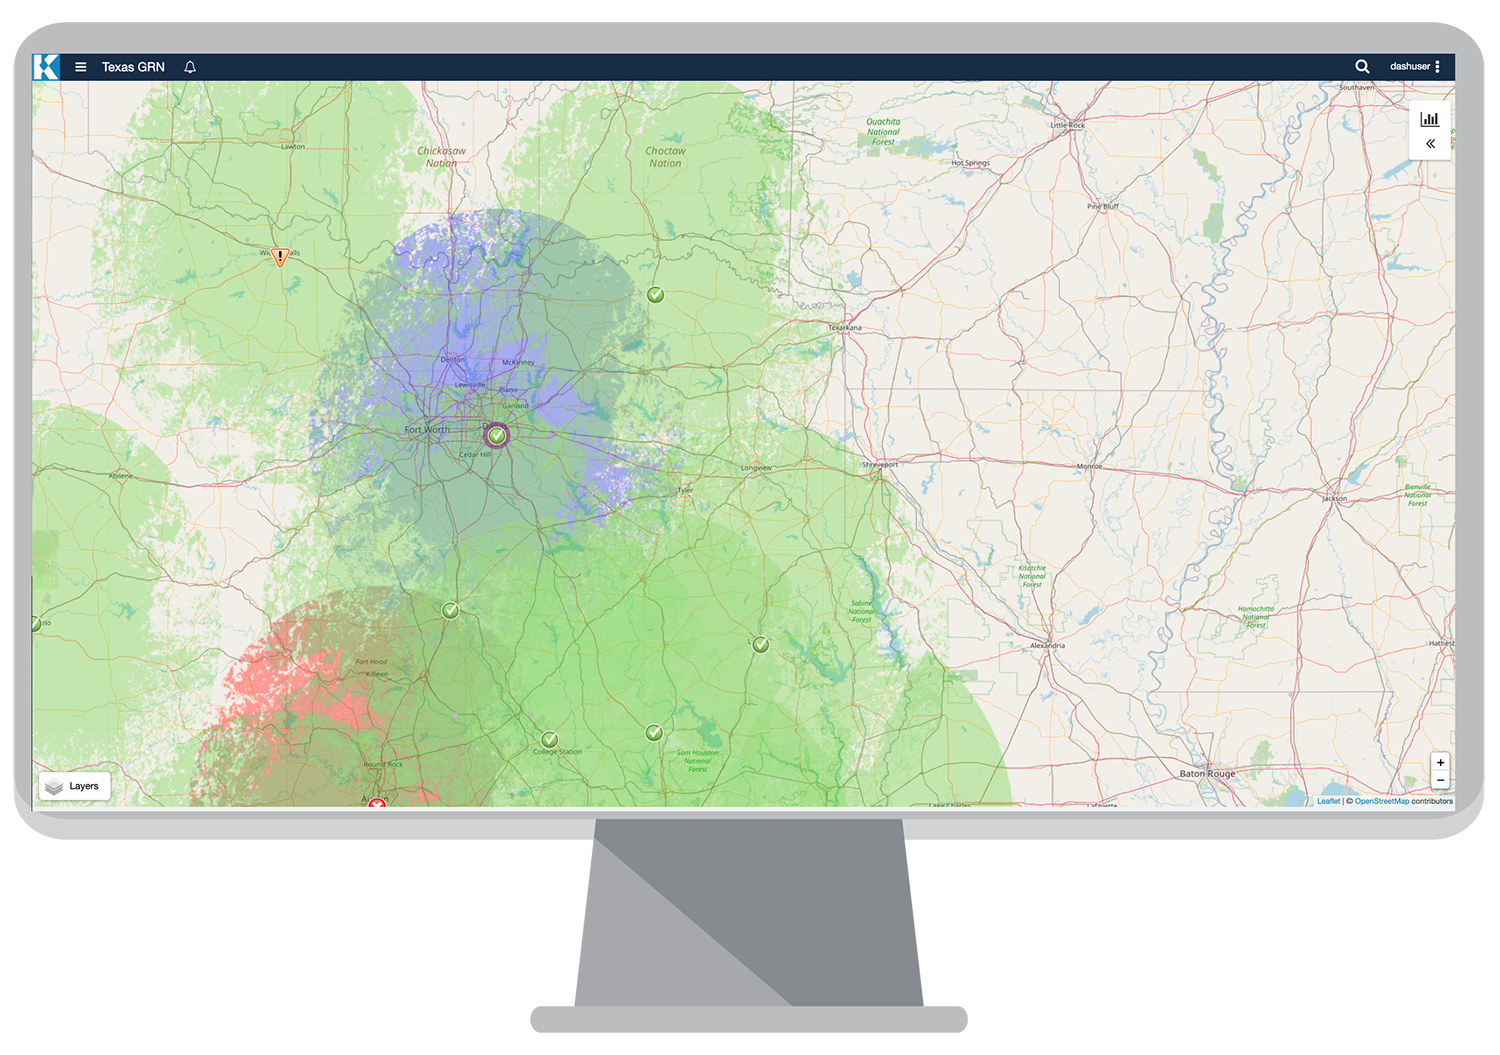
Forecast future outcomes based on historical data and predictive analytics, system users can simulate and predict the impact of planned maintenance or site outages on coverage and zoom-in to see the impact more clearly.
User Authentication
Two factor authentication to authenticate users based on group and role based access.
Alerts & Notifications
System wide threshold based alerts and notifications for sites with the ability to subscribe to
& snooze notifications.
User Defined Views
The right level of visibility and information is provided to users based on group membership, ensuring they are not overloaded with data.
Simulation
Display upcoming planned maintenance or simulate the impact of outages on coverage.

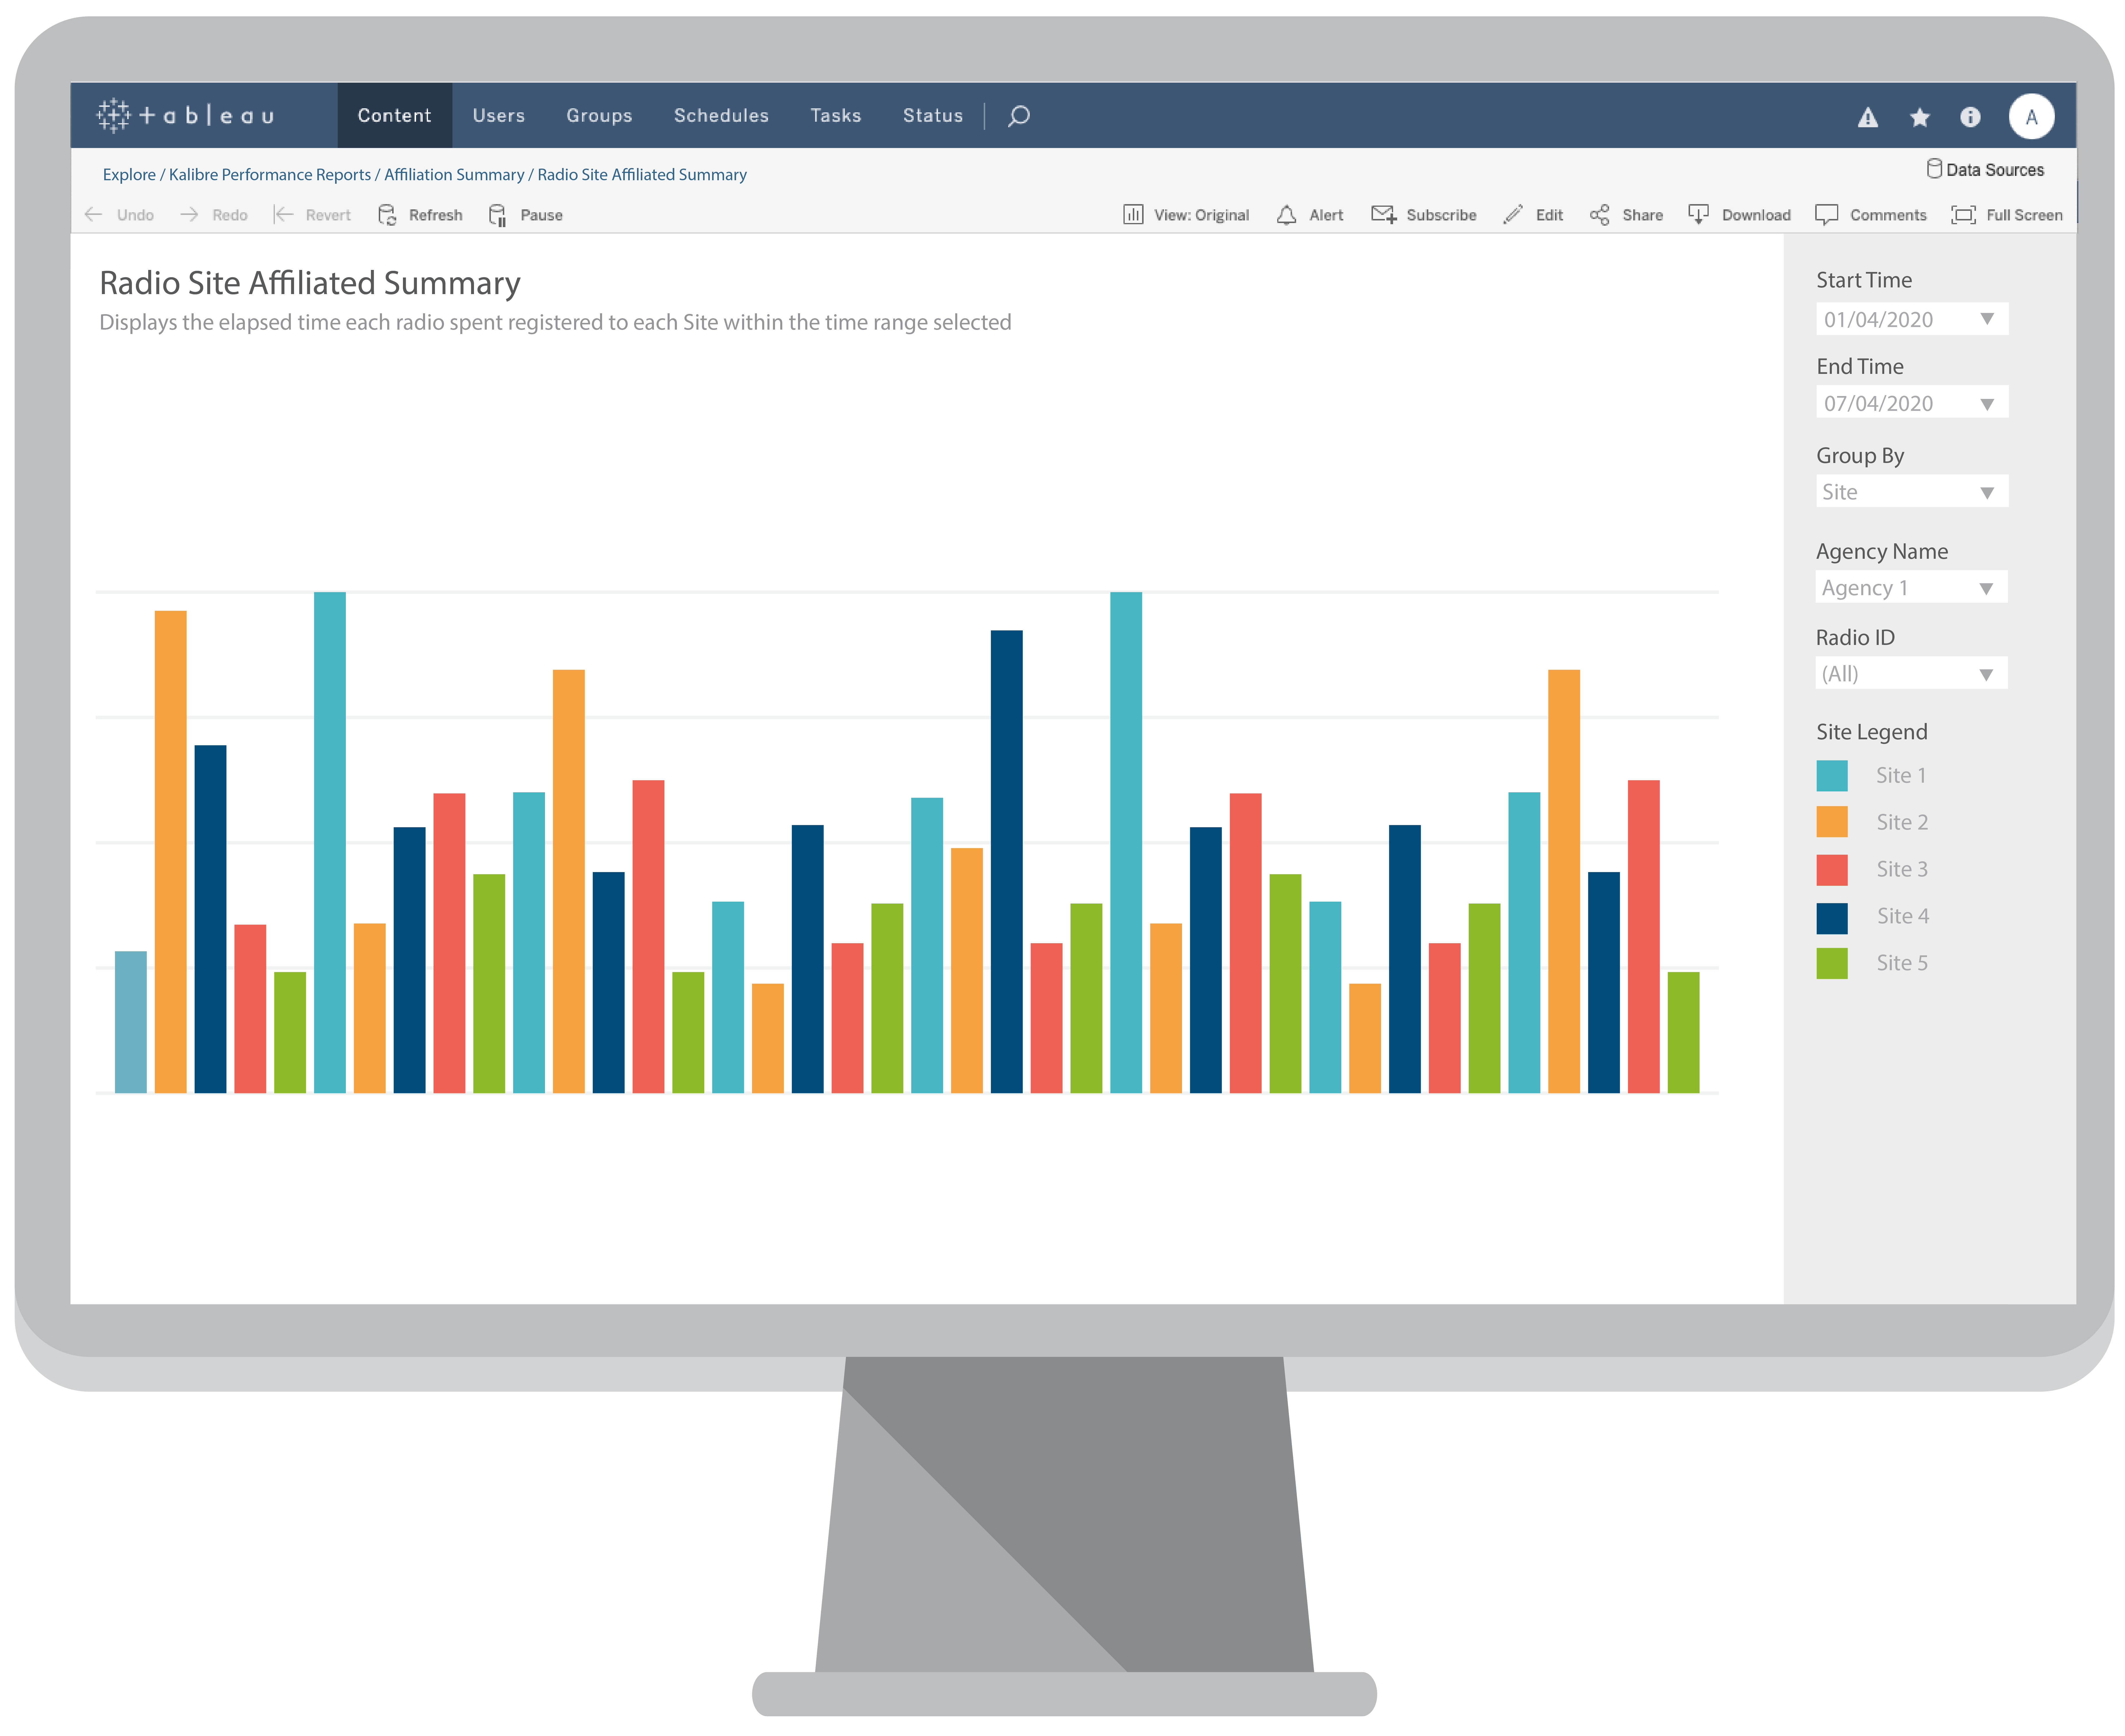
Performance Reports
Performance Reports leverage the full power of your operational data with Tableau’s powerful self service analytics platform. Interactive data visualisations display historical performance data that’s easy to understand, easily filtered and shared, putting operational data into the hands of all business users.
Performance Reports include charts, graphs and maps to represent system availability and capacity across a network.
Reports can be created for different levels of access, Management, NOCC, individual agencies or end users.
Filter reports to drill down further into the data to perform detailed performance analysis, examples of reports include time series charts with forecast models, Gantt charts showing detailed system use over time, and various summary and comparison visualisations.
- Enterprise-grade secure & governed
- Self-service analytics
- Utilise multiple data sources
- Interactive data visualisations
- Identify trends & patterns
- Detailed performance analysis
- Endless data exploration
Tableau Analytics